Machine learning has transformed the 21st century with its ability to record and process massive amounts of data. It provides a way to automatically find patterns and reasons about data.
Data is the New Oil
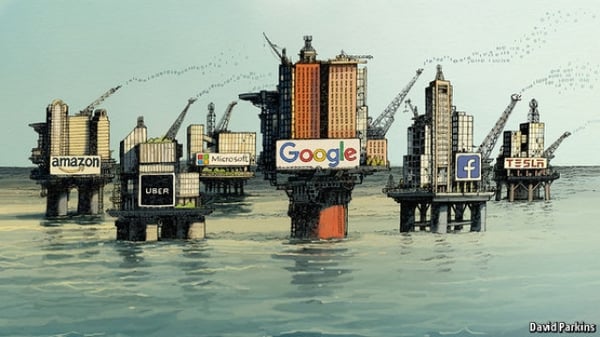
A report from inside BIGDATA read 'If Data is the New Oil, we're about to be busy'. It says that when enterprise execs and AI experts say data is the new oil, they mean its fuel for our information economy; the single largest driver of innovation.
So why the huge demand? According to the Alexa blog it comes down to the last decade where there has been a massive explosion in both data generated and retained by companies. Companies are now becoming fully aware of the value data can have on predictions and performance. The demand for data analyst/engineers/scientists is on the rise, however it is becoming more and more crucial for the wider party to be able to understand and articulate data science problems. Lee and Strong had commented that knowledge about work processes in a prerequisite for performing work, we investigate whether a certain mode of knowledge, knowing-why, affects work performance and whether the knowledge held by different work roles matters for work performance.
Data Visualisation

Hiring for an expert in data is expensive, the supply is limited and the domain needed is large. Understanding the between processes that are essential in building a machine learning model can prove to be cost effective and can facilitate more accurate results. This is where the role of data visualisation comes into play. By utilising data visualisation techniques we can teach the intended audience so much more about their data. Data visualisation makes data more accessible and less confusing, whether this is through software like tableau or just through coding with the use of histograms, correlation plots, and algorithms like principal component analysis and boruta. By using graphics you can show patterns, trends, correlations and relationships, making it easier to understand your best next steps.
By conducting data visualisation prior to hiring a data expert, a team can better understand exactly what problem they want to solve and whether they need to hire a data expert or if it's something they can solve themselves. Data visualisation can also be a stepping stone in your data collection and cleaning process. You can visualise how your data collection affects your machine learning model by having incorrect values, missing data, outliers and so on.
Data Optimisation Services
Among other Data Optimisation services, Data Analytics is offered to help organisation take advantage of their data. We develop predictive analytics dashboards which inform policy decision-makers and help organisations use prescriptive analytics to drive business benefit from intelligent recommendation engines and reduce the dependency on key decision makers.
Anaeko knows that to understand a problem sometimes means resorting to the uncomplicated language of data visualisation simplifying everything to a concept one can grasp. We strive to find insights within data and use these to improve better public services. If you want more information regarding data services, feel free to get in touch!
Topics: Machine learning, Data science, Data Visualization, Data Optimisation