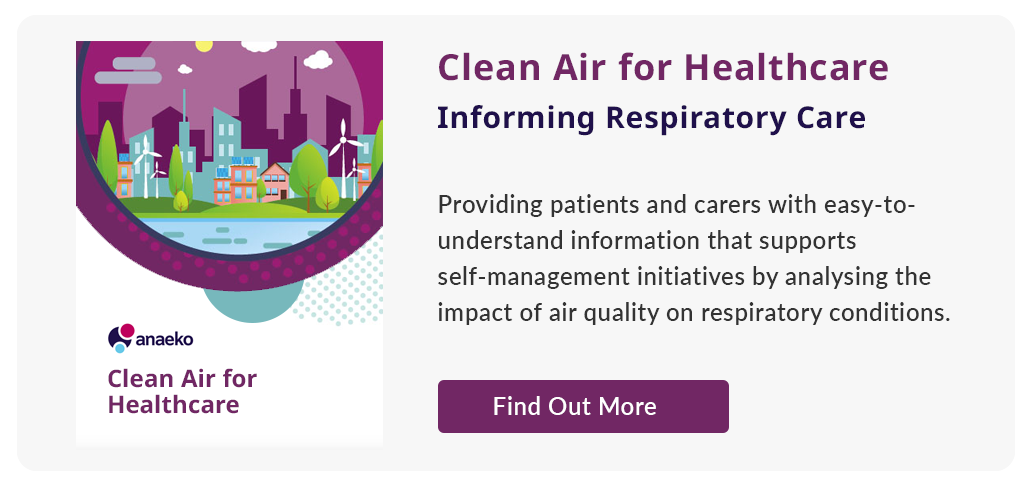
Clean Air for Healthcare
A use case had been identified were Anaeko could provide informative dashboards in order to determine and understand the relationship between air quality and health conditions.
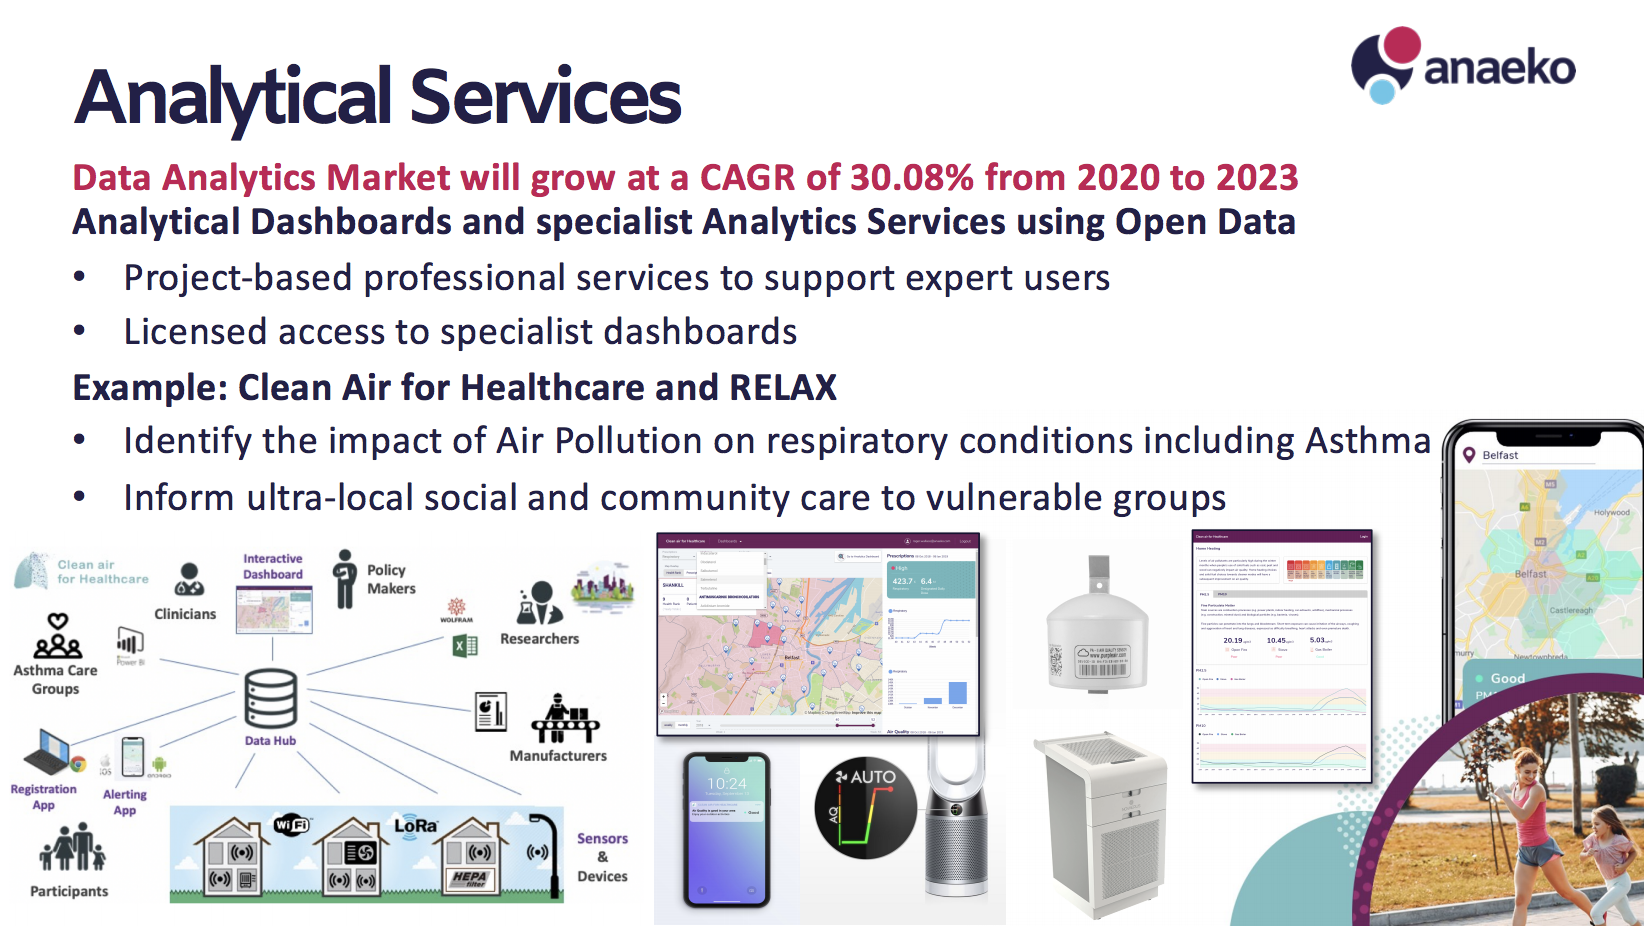
Prescription data had never been visualised or analysed before so discovering trends and anomalies would allow pharmacists to adjust ways of working to change patient care and improve spend. By providing multiple users from pharmacists, researchers, clinicians and patients with the correct data types and dashboards, real time data and actionable insights could be put into the hands of the user.
A health data research platform was built by combining 11 sources of data across health, geospatial and pollution. A mobile operational dashboard for patients provides a map view of their area, including local amenities, with an overlay of air pollution quality highlighted red, amber or green allowing individuals to see the current status and base their outdoor activities or travel routes on the data to avoid unnecessary respiratory attacks. Graphical views of air pollution with real time, historical and above EU regulation base lines means patients can see how air pollution changes over a day, week or month to assess the best days and times for activity. Including predictive notifications personalised for patients, based on trends and analysed data, informs lifestyle changes for a better quality of life.
An analytical dashboard for pharmacists and researchers gives controlled access to multiple sets of data in order to visualise trends, spikes and anomalies in never before analysed data. An interactive graphical view of prescription data over years, months or days allows users to see relationships between different conditions and predict timely event based changes in air pollution that could increase respiratory or diabetes prescription orders. Having access to a map view of all areas with data aggregation and RAG status highlights, over time, gives a clear overview of high prescription level areas, low air quality areas and health ranks so pharmacists can take action to target specific areas by adjusting their message and influencing the care of patients based on multiple factors of long term health conditions.
A data hub with a set of user defined dashboards on top allows each dashboard to be user specific. A view of real-time aggregated data and critical insights for that user. Giving access to various areas of a platform and data that can be analysed, compared and drive decision making.
Anaeko are Hiring!
If you are an enthusiastic and energetic software engineer looking for continuous challenges in a rewarding job, then get in touch.
We are hiring multicloud data and platform engineers across Go, Kubernetes, Python, Java, .NET and Angular to name but a few.

Topics: Data Analytics, Open Data, Healthcare, Analytics Services, Integrated Analytics