Air Quality Data exploration
It's tempting to attribute the issues to purely location there is a relationship between where people live and pollution or is there a relationship that we can demonstrate and this is where our investigation takes a turn and we start looking at air quality.
On this slide you can see for example the kind of air quality services that are publicly available today, and the approach is very similar to the pollen forecasts that you see in the news, air quality forecasts try to mimic weather forecasts. Their approach is generally seeing wealth forecasts as a gold standard but air quality is different to weather forecasting people genuinely want to know what's the weather might be like later today or tomorrow but they can see what the weather is like now because they just look out the window but you can't see what pollution is like even if the pollution is bad enough to actually affect you you still cannot see it. So there is a critical difference between air quality and weather another critical difference is that short localised weather events aren't really that important because sure someone might see the weather forecast for mostly fine and not take an umbrella and they might be unfortunate enough to get caught in the down poor that's local and they're a little annoyed maybe they spend a wet afternoon and that's no harm done. The weather forecast for fine weather is perfectly reasonable generalisation.
That brings me to our third hiccup of this project what we were seeing was the data available for pollution didn't offer the kind of localiSed real-time view that we were starting to believe was necessary to inform people about what's happening in their area. We decided to bring our own data to the table. We decided to measure our own pollution and that's thanks to a collaboration we had with another Belfast company and we were able to quickly deploy multiple pollution sensors across Belfast. You can see on the map these sensors were able to provide us with real-time means particular pollution both indoors and outdoors and you can see from the map that we place them around Belfast to build up a picture of the different conditions in different parts of the city. It is the placement of these IoT pollution measurement devices that kind of brings up that final hiccup of our SBRI story.
It was our experience that any discussion with the government agency to place IoT devices on government property will quickly break down if you're working on an IoT project with government. You really need a backup plan and you really need a very long term discussion about how you might get these things installed and managed and the responsibility. The impact that they might have so this is something that you need to consider now in the end what we managed to do was place these at private residences that we had access to and so we side-stepped local government. So all of these sensors are basically people's houses in suburban areas across Belfast and some office buildings in the city centre.
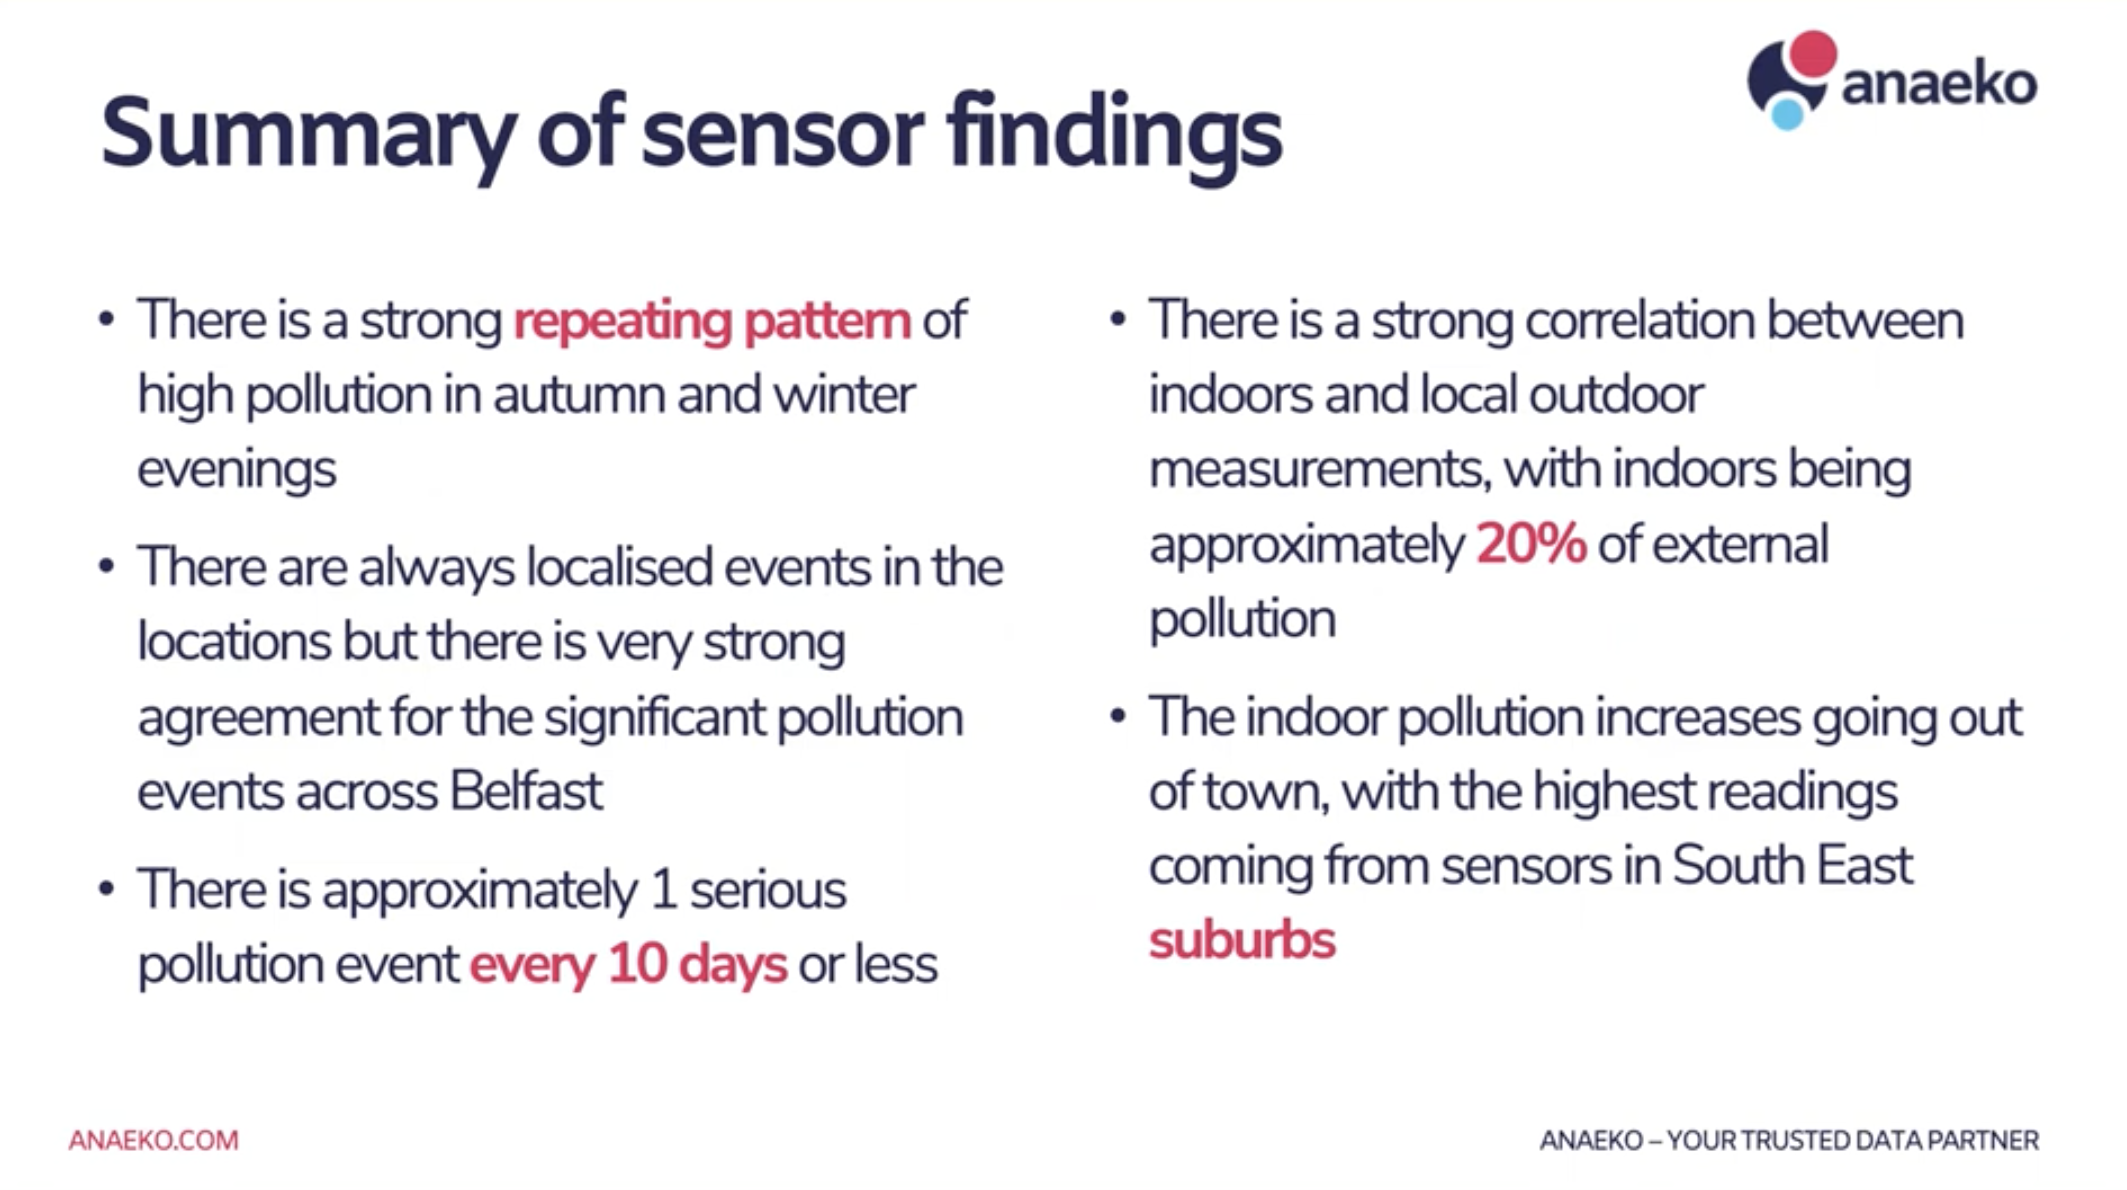
Very briefly we can take a look at the sort of data that we collected. Here you can see the kind of insight that we got from our real-time sensors. Our study tracked both indoor and electrical pollution which is unusual and we find that indoor levels of pollution you can see on the left-hand graph are roughly around 20 of what is happening outside so any measurement that you are getting from an external data sensor can can be inferred the level of complete pollution internally. Very large spikes in the pollution do happen and do cross over to indoors so what's happening outside can impact you inside. It's not uncommon for indoor pollution to reach levels that could impact the health of people living with hot conditions.
We also tracked regular high pollution events that would otherwise be smoothed out by normal air quality, reporting and forecasting these events occur regularly they coincide with people arriving home from work, turning on their home heating our wood burning stoves and fires. You can see on the right an example of an event that happened on election night in 2019. The blue line shows the city centre, the red line shows suburban southern part of Belfast and you can see that the events occurred on the same day but at different times. So different people in different areas of the city will be affected at different times of the day. When I was walking on that night I can tell you it was difficult to breathe, so this is a real event-driven, real-time need for information in your local area.
Topics: Open Data, Healthcare, data discovery, Innovation, data sharing